While we are impressed by the dedication and effort that ticketing teams show every day in solving operational problems, filling seats and thinking ahead to what new challenges may come in the next season, we would like to highlight 3 ways to drive your ticketing to the next level. Let’s increase Sports Clubs Ticket Sales, based on machine learning.
The secret source for improving your ticketing performance
When was the last time you changed the layout of your stadium? “Good question, actually I don’t know. The layout of our stadium has been looking nearly the same for the last 5 years or so”. Does this sound familiar to you? In most of our projects we see that stadium layouts have not changed for a very long time. Here and there some shifts of blocks took place, but no general overhaul was conducted.
When speaking with decision makers in sports, there is a tendency to directly focus on the price point itself or how fans would react to an update of prices. Fewer discussions go one level deeper. How many seats are offered at what price point?
The seat capacity distribution is a major factor in optimizing your ticketing performance. The concept is applied at every airline. The basic idea is to allocate and manage the right amount of tickets to the right price point in order to maximize revenue. That’s what is commonly known as Revenue Management. Airlines manage the price/ticket ratio on single flight level.
Within our projects for sports clubs, we made the following observations:
- Block capacity for day tickets is a result of season card sales and not actively allocated
- Imbalanced sizes of price categories
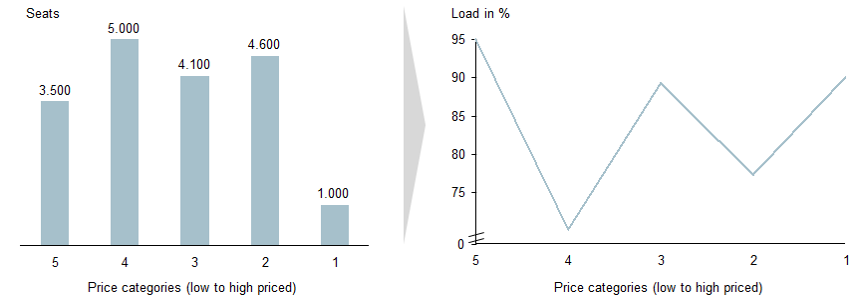
- Mismatch between load and value of the price category (e.g. like in the example below PK4 has 5.000 seats, but one of the lowest loads overall)

Left: A typical distribution of seats per price category.
Right: Mismatch between load and available seats
We encourage to review not only prices, but also analyse the seat distribution in your stadium regularly. Some clubs like Hertha BSC or FC Bayern Munich Basketball analyse and update their Stadium and Arena layout every season, sometimes even on individual game level.
Only 56% of the demand is impacted directly by the opponent, while 44% depends on other external factors
Having ran dozens of pricing optimization projects in the European Sports Sectors, it always strikes us when we discover that games are purely priced based on an opponent’s name.
It is true that the name is the single strongest indicator for demand. However, after running multiple analyses for our clients, our Data Science team found that the opponent name explains only 56% of demand variation. Other factors like team performance, weekday and time of season make up for the remaining 44%. The importance of external factors, other than the opponent, obviously increases as the game day comes closer.
Since most clubs do not account for other external factors, we found that typically 1/3 of games are mis-priced.

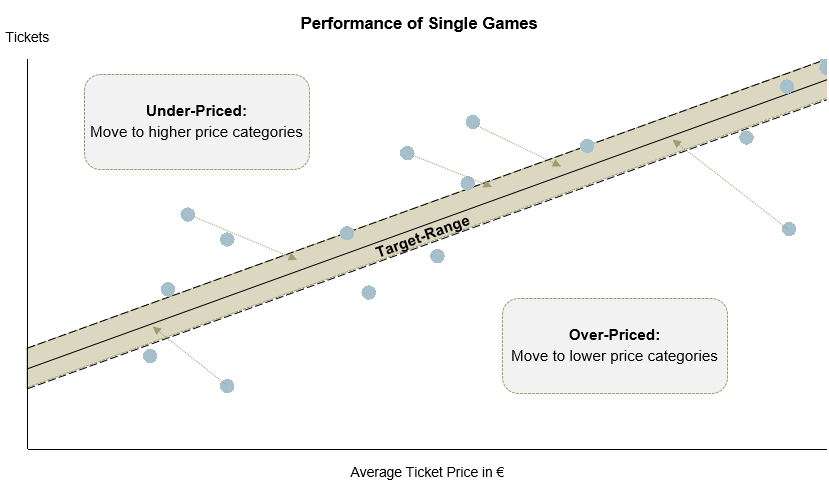
The above graph shows the performance of single games in a season. It displays the structure we often see in our projects. Some games are under-priced (above the target-range) and others are over-priced (under the target-range). Our experience shows that these potential is up to 1-2% of your day ticket revenue. Assuming a 10 million EUR ticketing revenue base, there is a potential of 100 – 200 thousand EUR per season.
Given that you will not directly turn the wheel 180° around and implement a dynamic pricing scheme, we recommend to:
- Reproduce the above graphic based on your data and check on mis-priced games
- Stop pricing based on opponent name only and also take the 44% of other factors that will drive overall demand for the game into consideration
- Assign a game to your price list as late as possible (e.g. when you start your sales)
90% of managers agree that price lists limit development in pricing
Price lists, often in PDF-format, pinned on the homepage, at fan-shops and printed in flyers, remain the most common pricing communication for many sports clubs in Europe.
Having spoken to dozens of ticketing managers across Europe from various sports sectors, 90% agree that price lists are holding back innovation in ticketing.
Once freed from the limitations of old-style price lists, the ticketing managers can start with their initial job purpose – actively managing inventory. We know that we will not change the industry within the blink of an eye, but we would like to encourage you to follow examples like
- FC Hansa Rostock (Football)
- Frankfurt Skyliners or FC Bayern Munich Baskets (both Basketball) or
- Füchse Berlin (Handball).
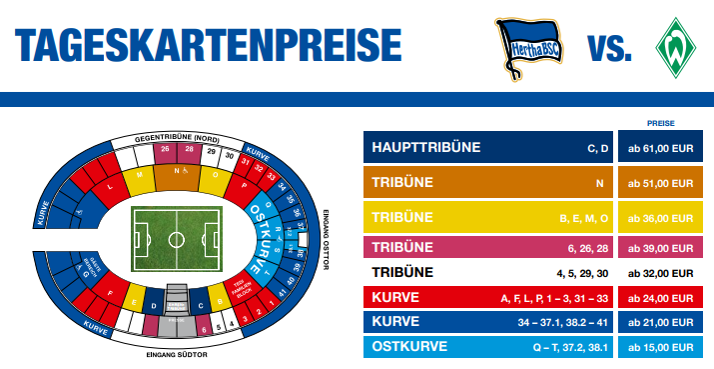
They have taken down their price lists completely from the homepage. Fans see their ticket prices directly in the online shops. Similar approaches are taken by clubs like TBV Lemgo (Handball), Kölner Haie (Ice Hockey) or Hertha BSC (Football) – they still publish price lists, but with “starting from” prices.

Screenshot Hertha BSC Homepage
Regardless of the option you choose between taking the price list down completely or communicating “starting from” prices, there are multiple success stories which prove that both of these approaches work and that fans understand them.
In conclusion: Plan ahead
We suggest to take a fresh look on your sports ticketing business.
Here are 3 things that you should take to the discussion at today’s lunch break:
- Re-designing your stadium layout
- Allow your pricing flexibility – science has proven that there is more to demand than the name of your opponent
- Adjust the communication of your prices – your fans are used to seeing prices in online shops after selecting the game or working with prices “starting from”
Thank you for reading! If you found this article helpful, we would be happy if you could share it.

